

ISO 9080 long-term hydrostatic strength, from spreadsheet to report
CreepFit fits a laboratory's pressure test results to the standard's model and gives the 97.5 % lower prediction limit at the 50-year design point, the knee where there is one, and the extrapolation limits, on the screen and in a PDF report.
No account and no email address. A trial workspace is deleted after 72 hours without use; its reports carry a Demo watermark.
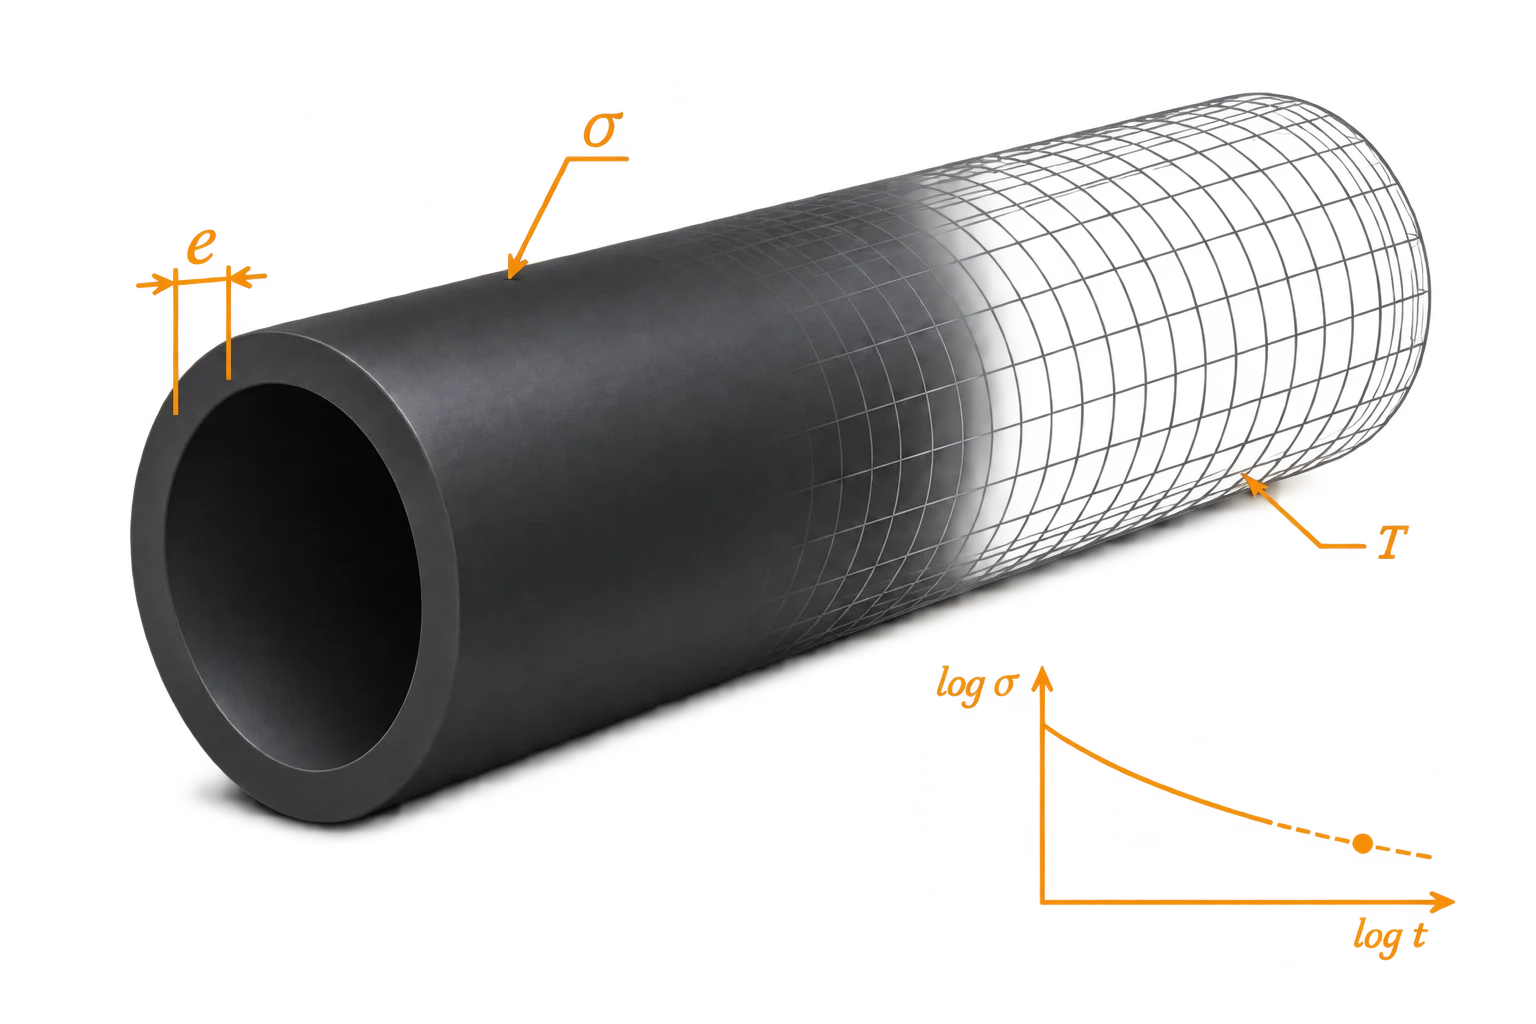
Three steps
- 1
Spreadsheet in
The laboratory's .xlsx file: temperature, stress or pressure with the pipe's dimensions, time, run-outs and failure mode. Columns are found by their headers.
- 2
Analysis
The regression, the knee test, the 97.5 % lower prediction limit and the extrapolation limits, computed on the server by one engine of a pinned version.
- 3
PDF report out
A report with everything the standard asks a test report to state, stored as it was written.
The analysis
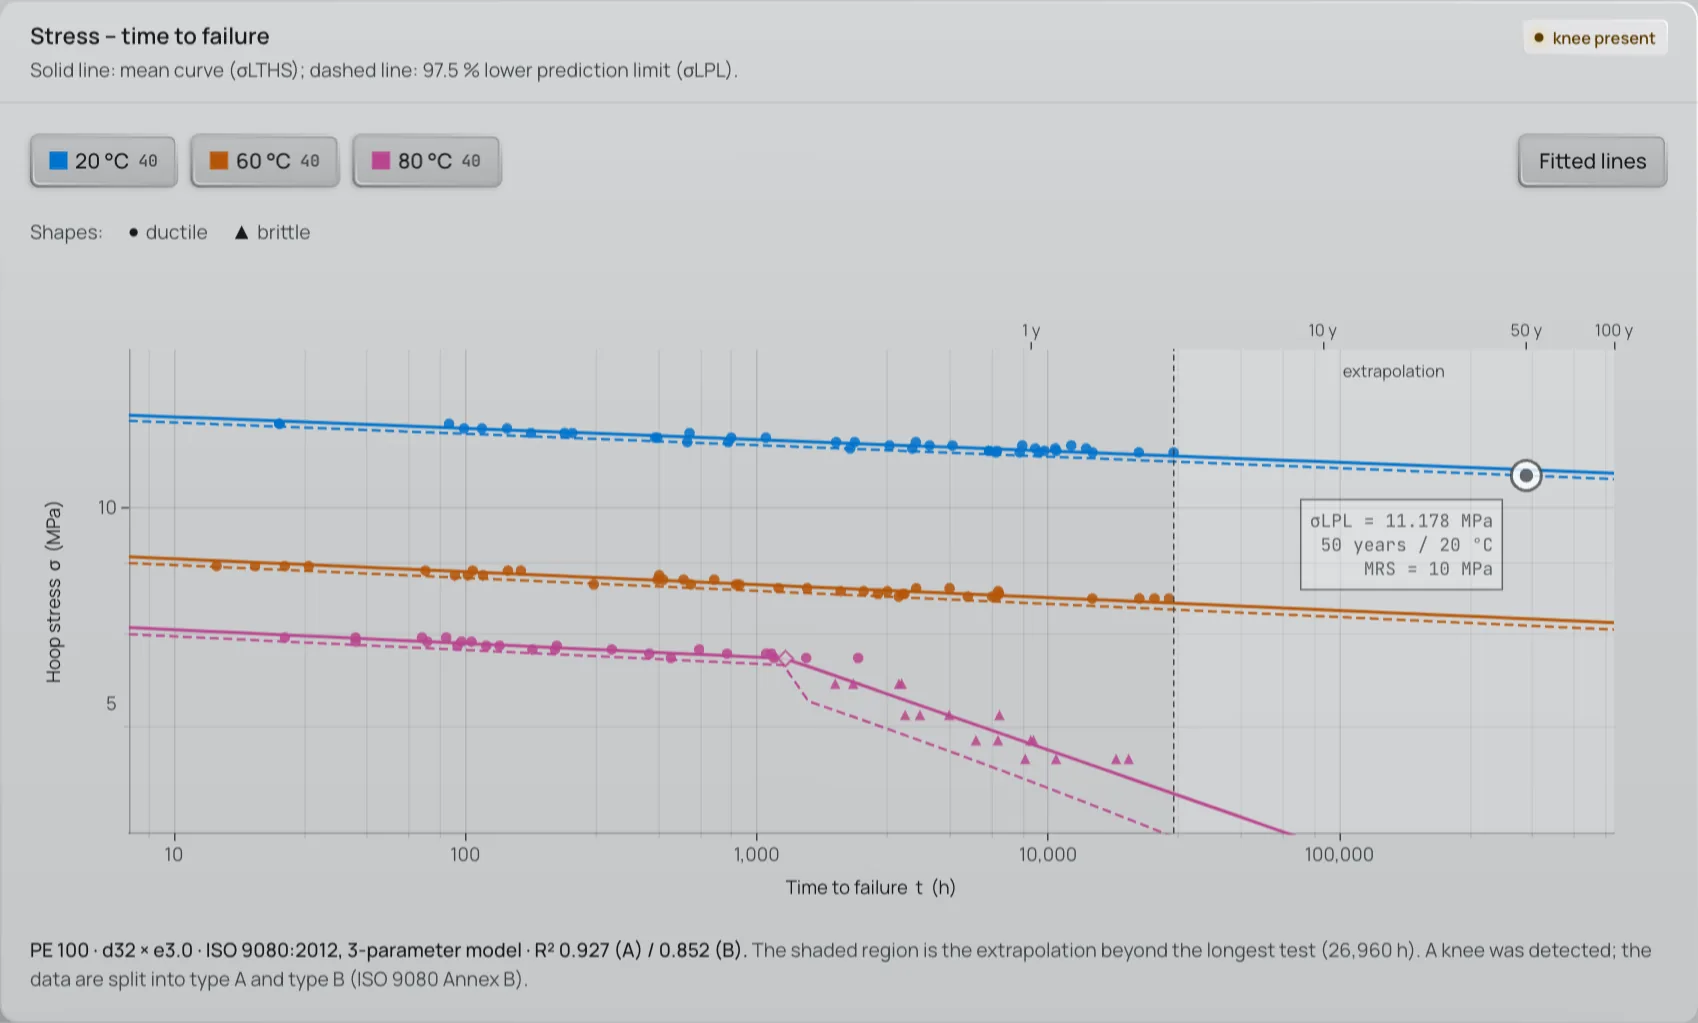
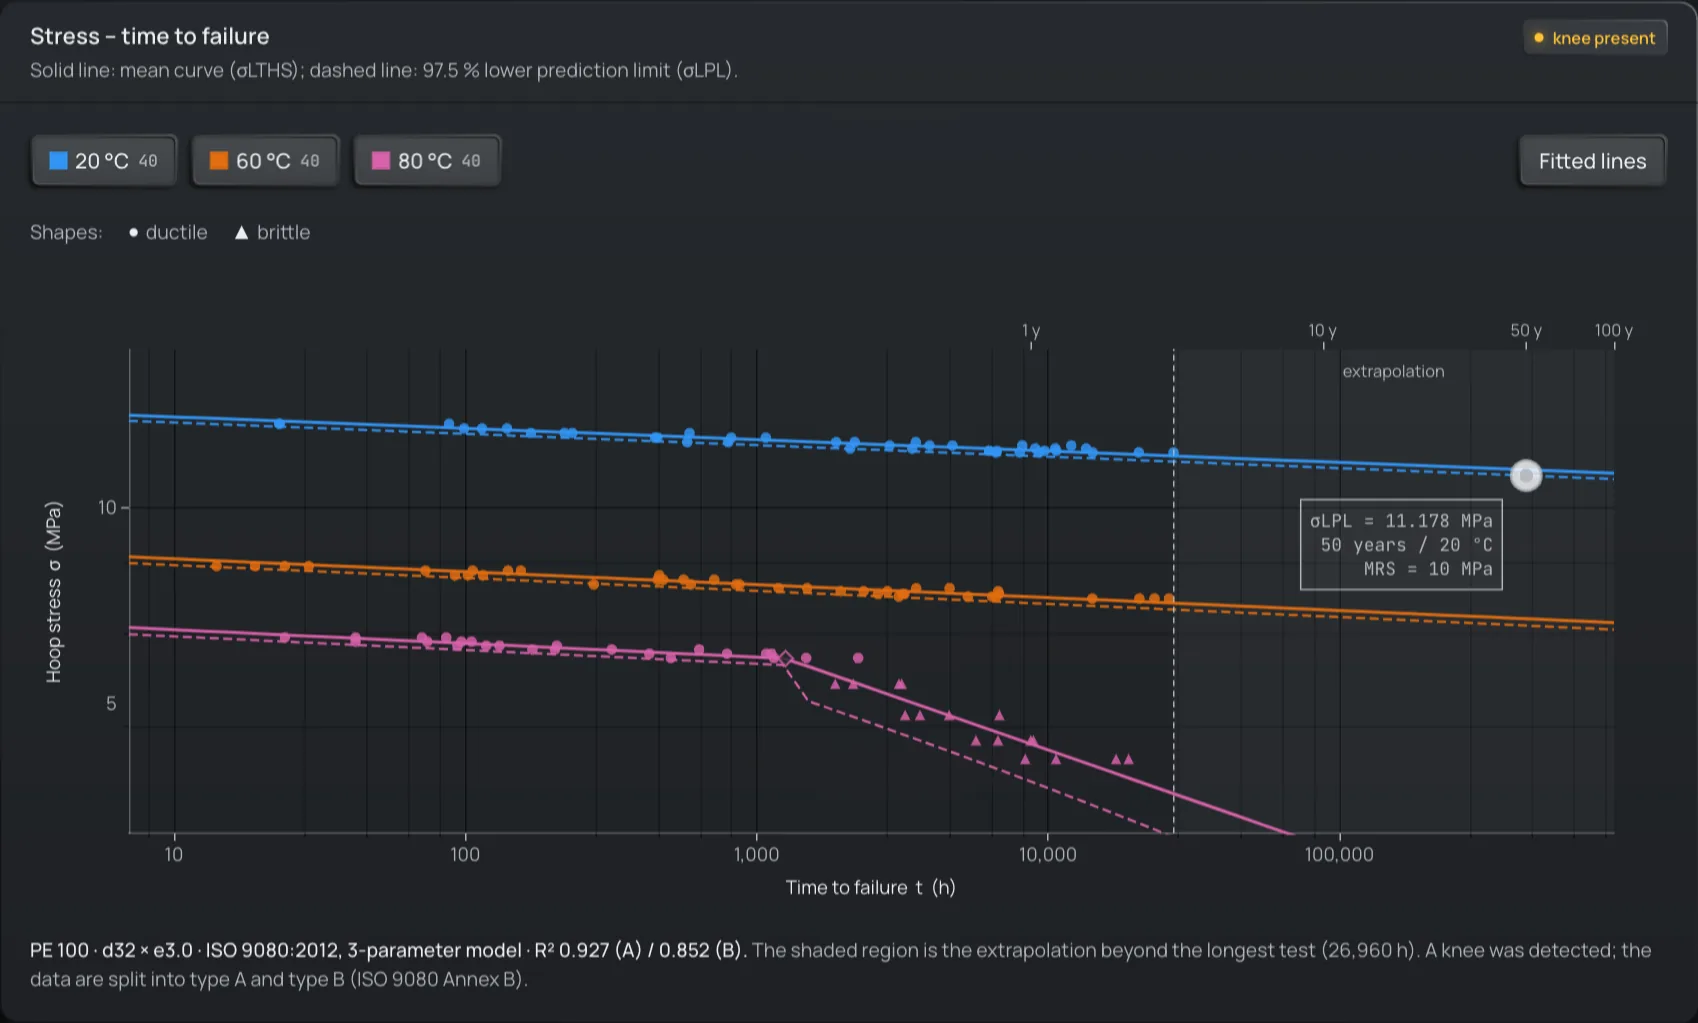
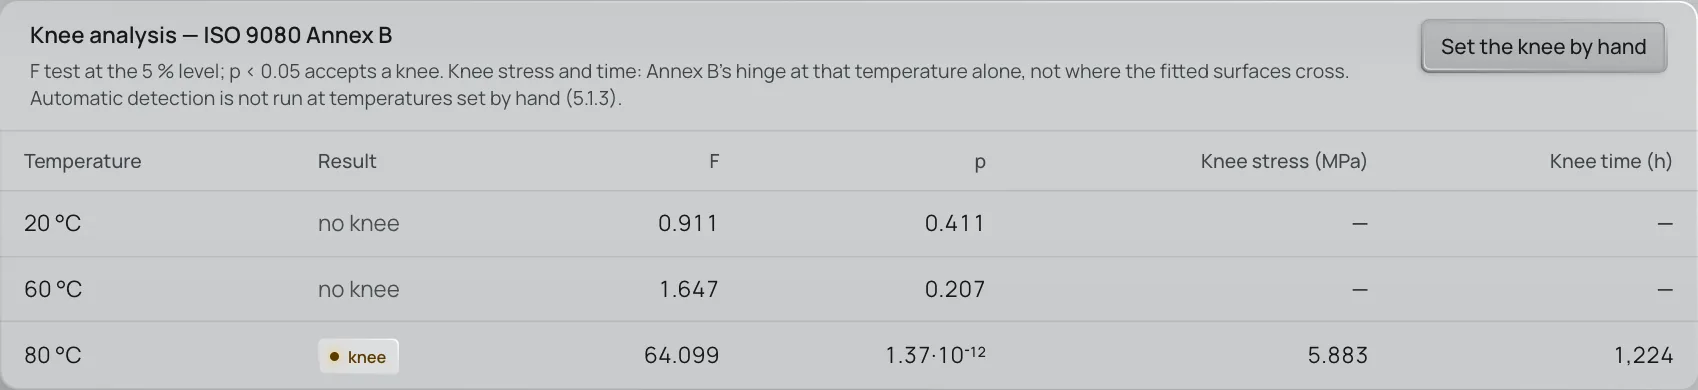
The knee is looked for at each temperature on its own, as the standard asks; the table gives its stress, its time and the test that decided it.
- Automatic knee detection at every temperature; a manual override asks for a justification, and the report prints it.
- Prediction temperatures: the fitted model is read at temperatures that were not tested, as far as the standard's extrapolation limits allow.
- A check against the material's reference curve (e.g. ISO 15874-2), on the screen and in the report.
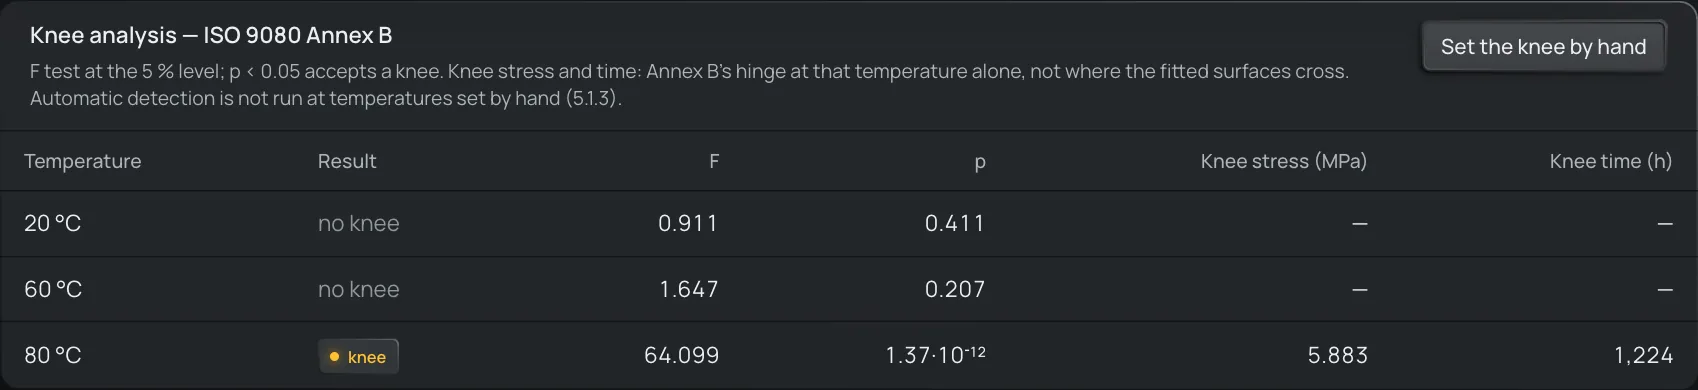
The tables
The tables on the screen, with the same numbers the report prints.
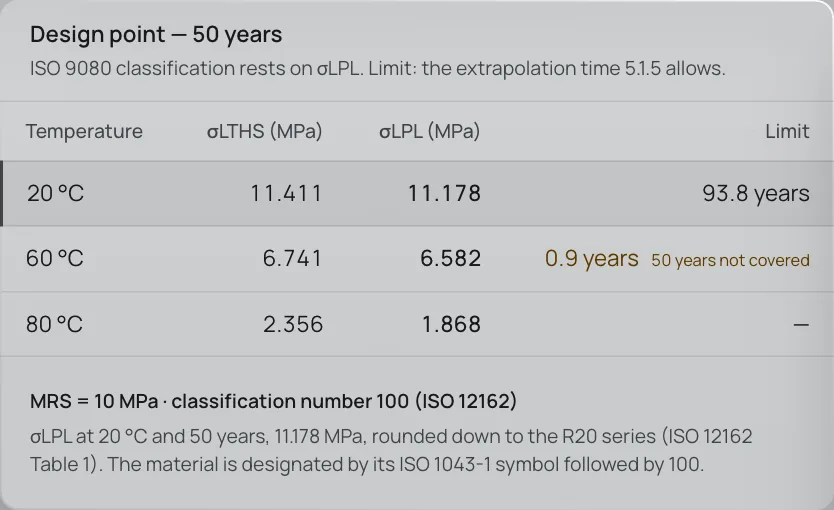
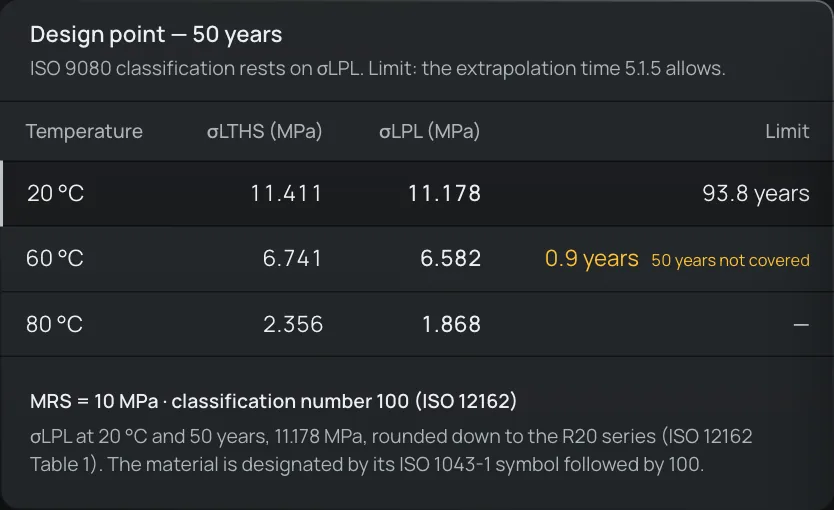
Design point — 50 years
The mean strength and the lower prediction limit at 50 years for each temperature, with the MRS classification of ISO 12162.
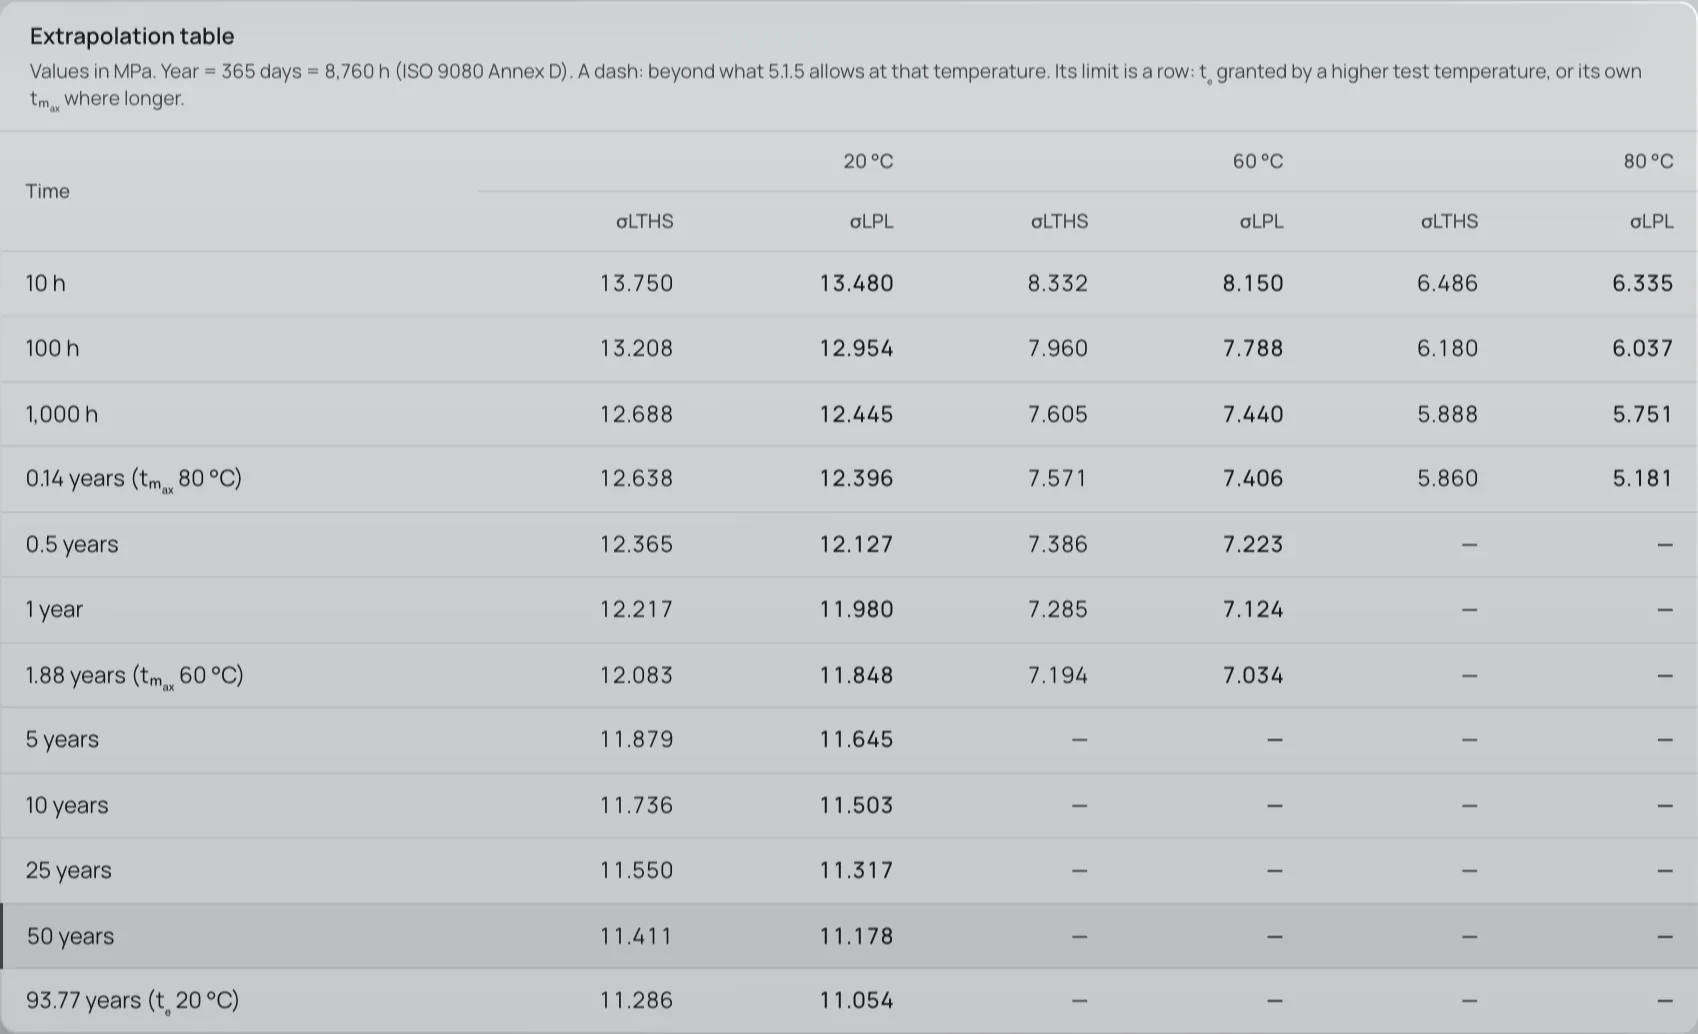
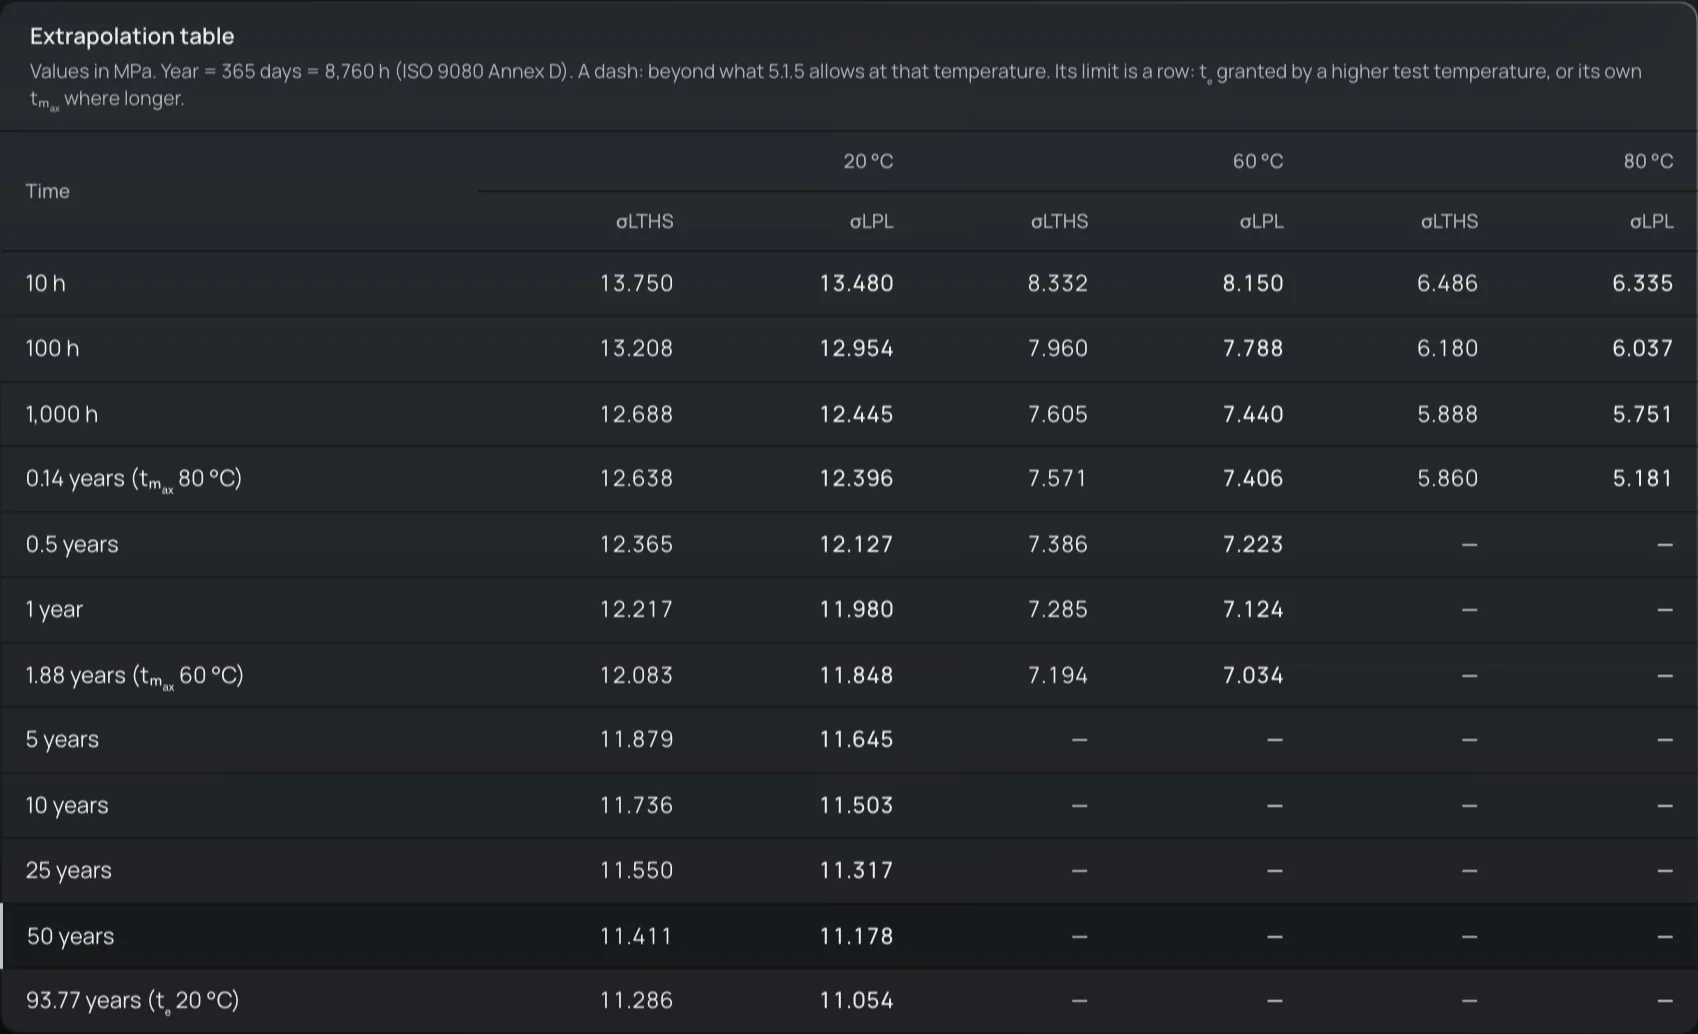
Extrapolation table
The strength from 1 to 100 years, stopping where the standard's extrapolation limits stop.
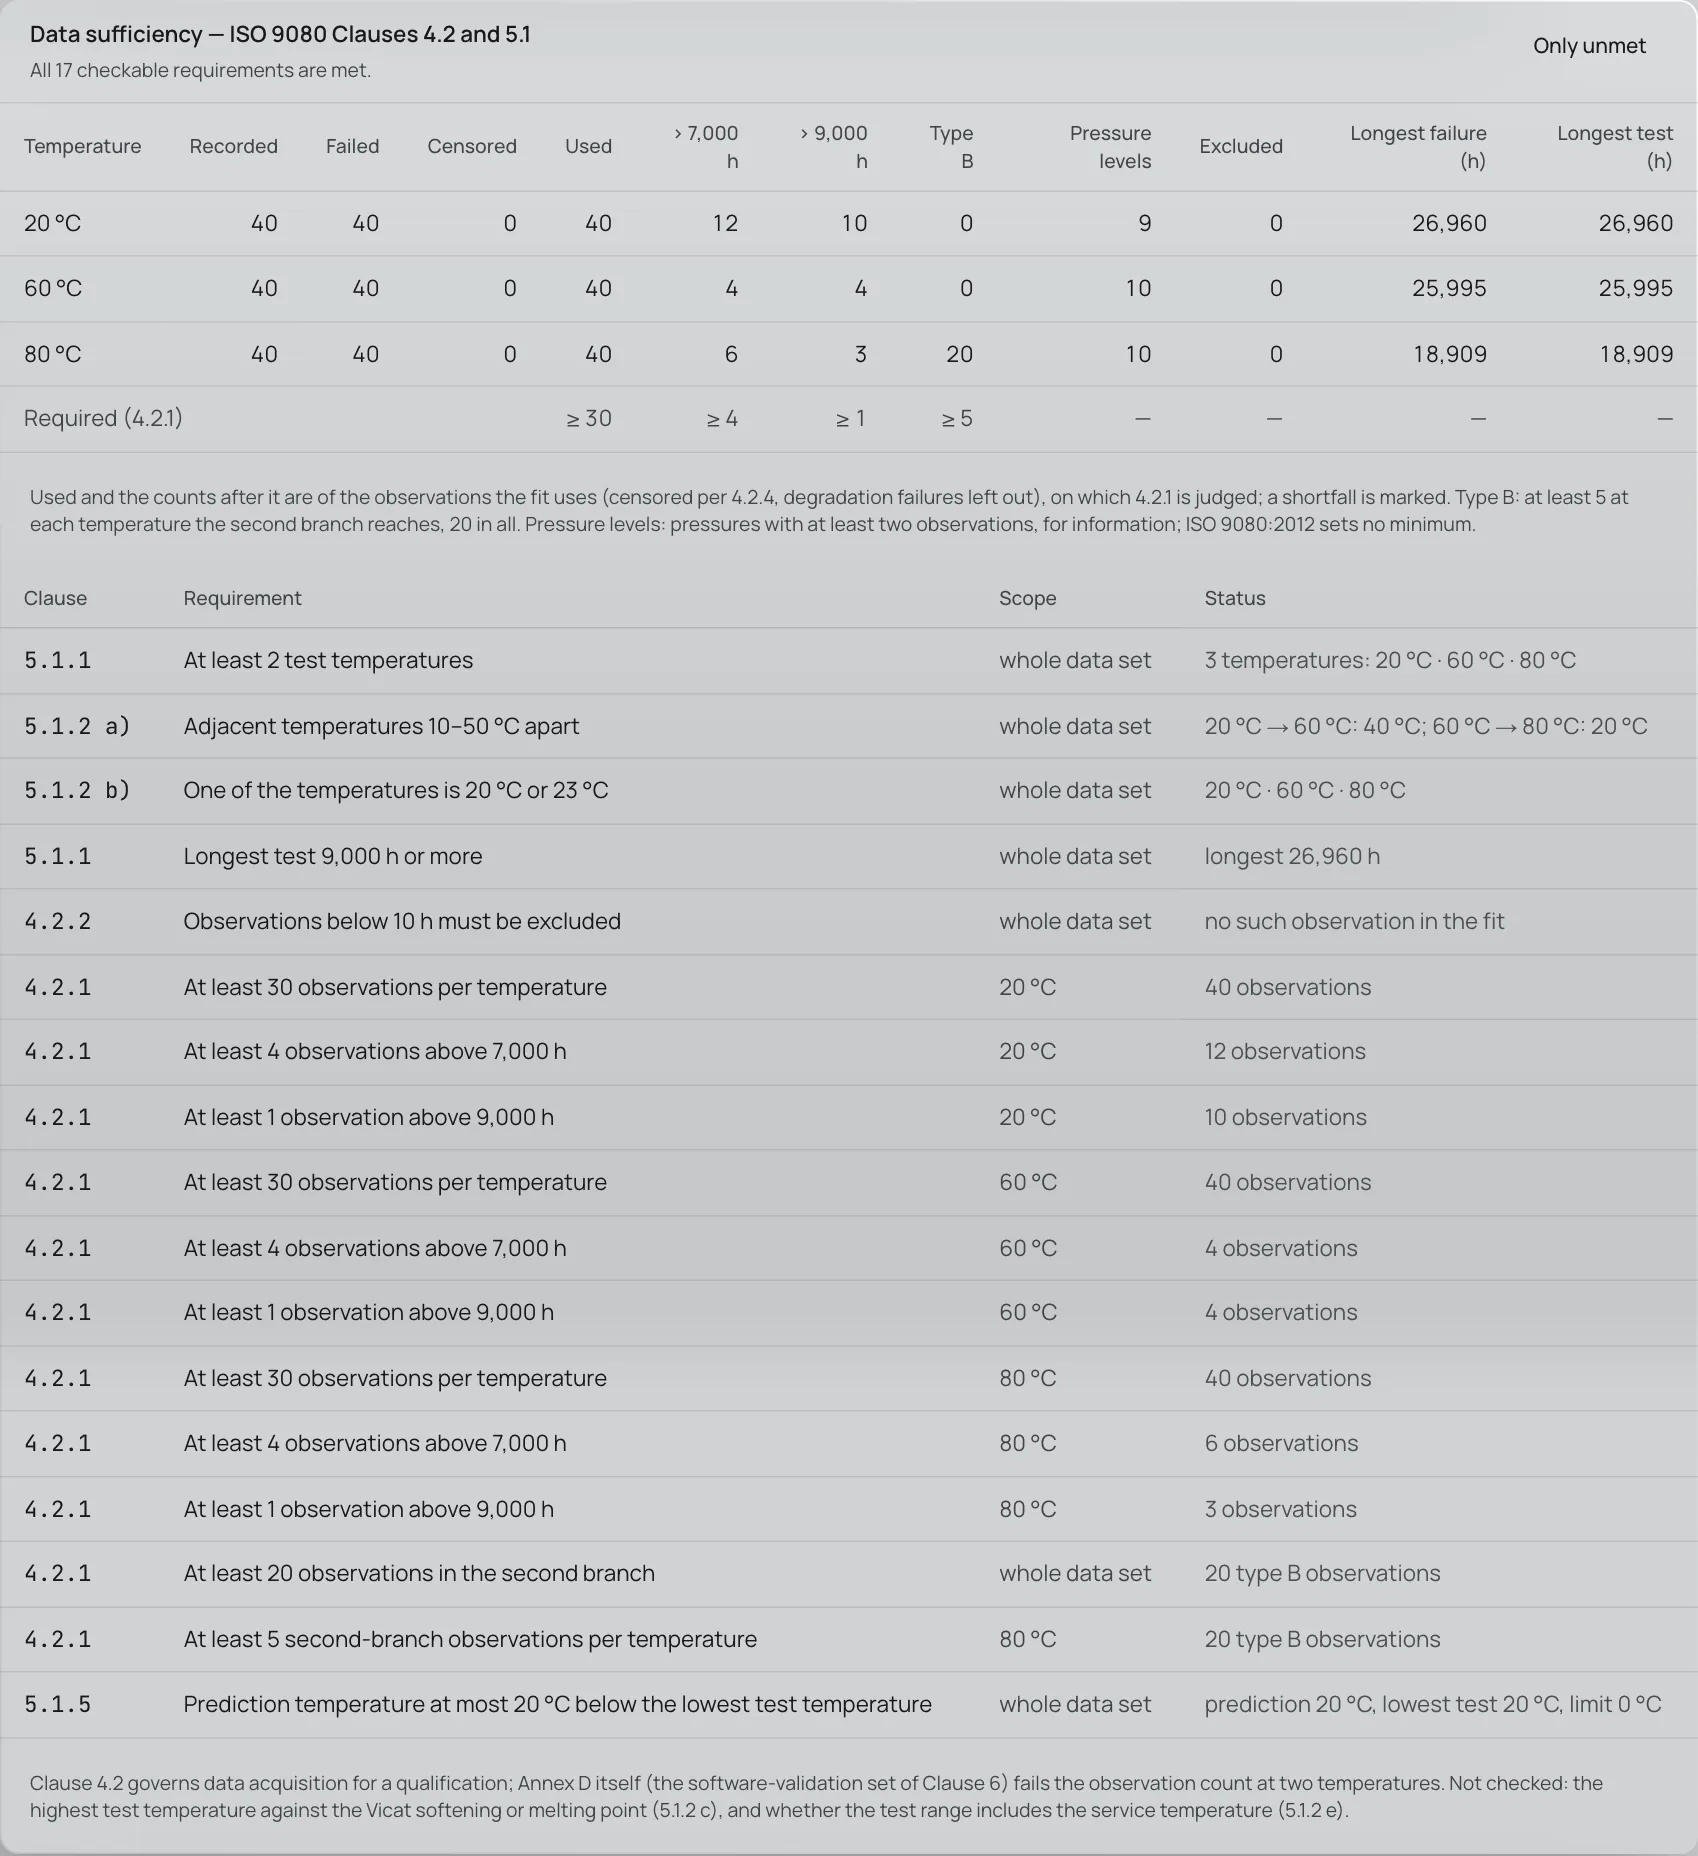
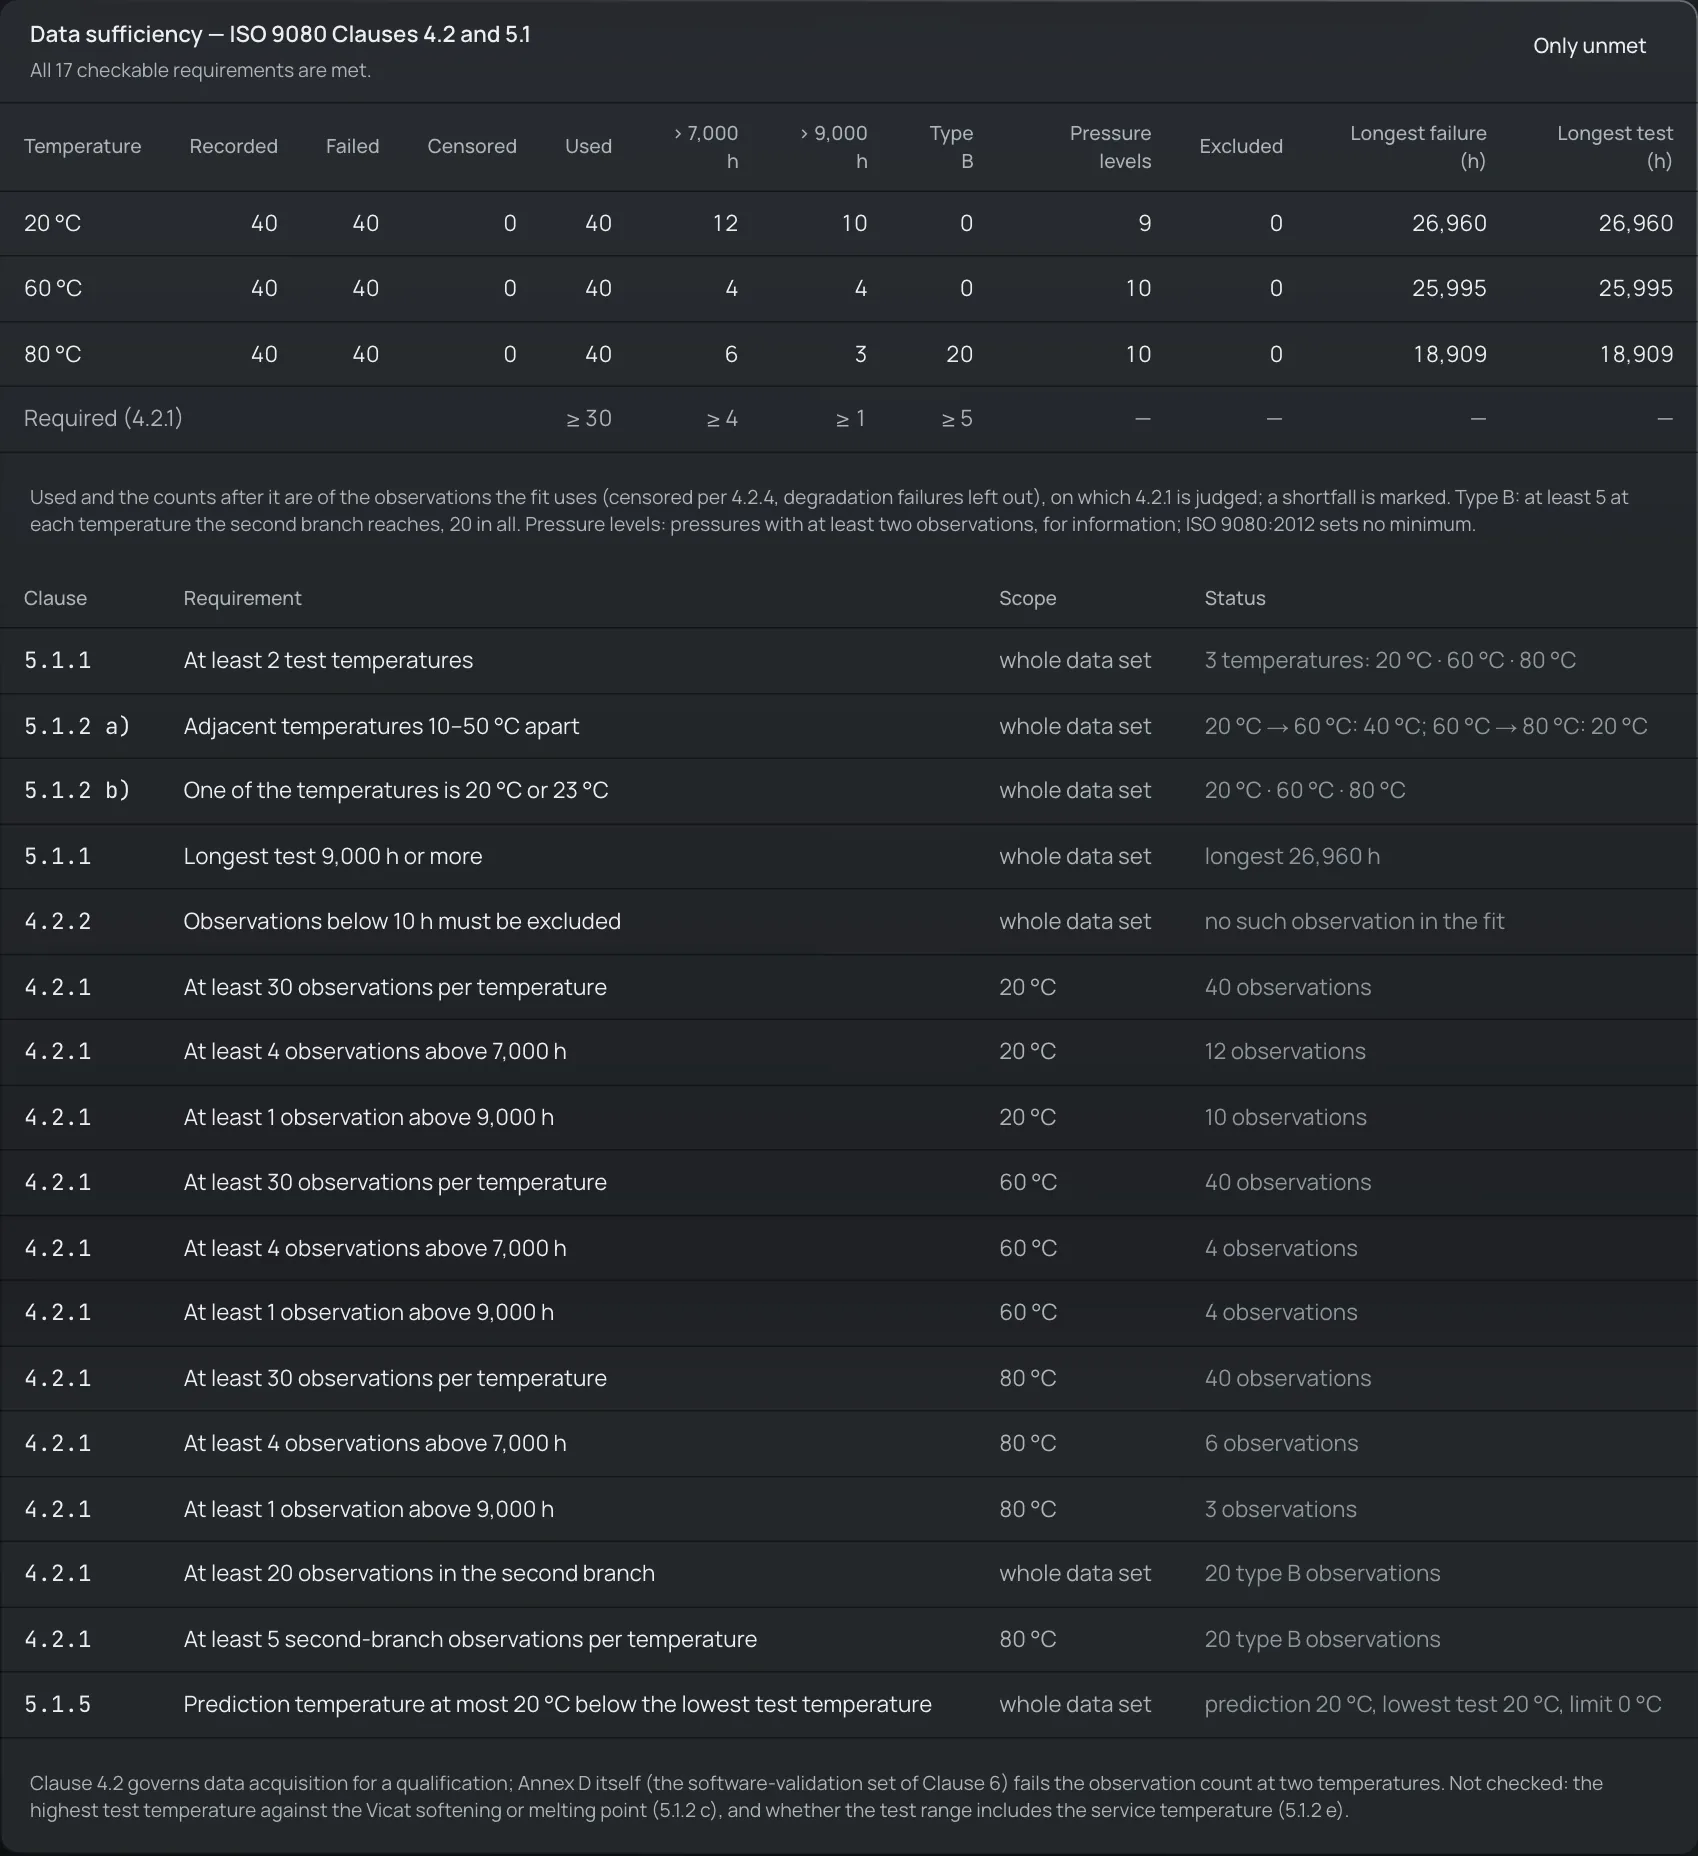
Data sufficiency
Every data requirement of the standard judged against the data, with the counts per temperature.
The PDF report
Everything the standard asks a test report to state, in the language it was asked for. The sample below was made in a trial workspace, so it carries the Demo watermark.
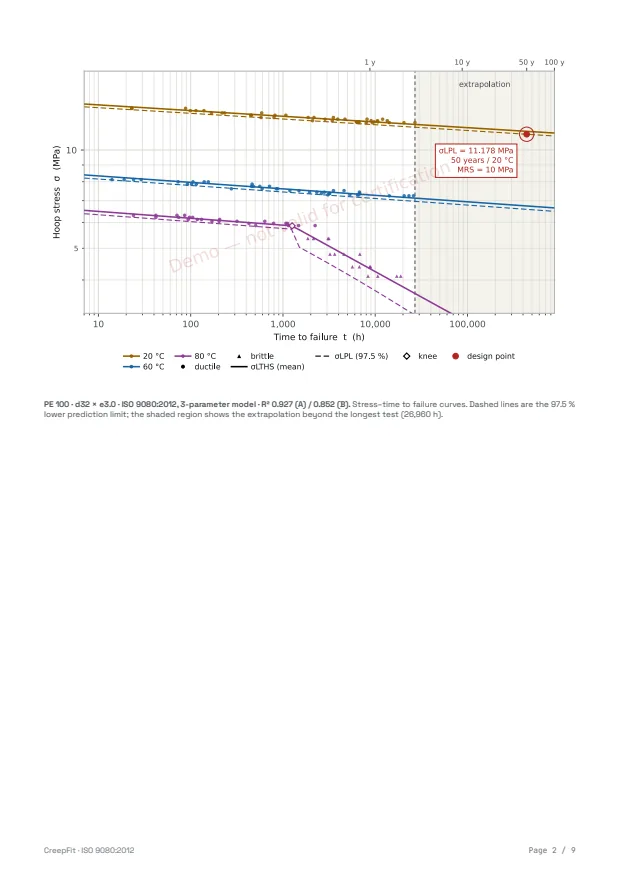
The chart 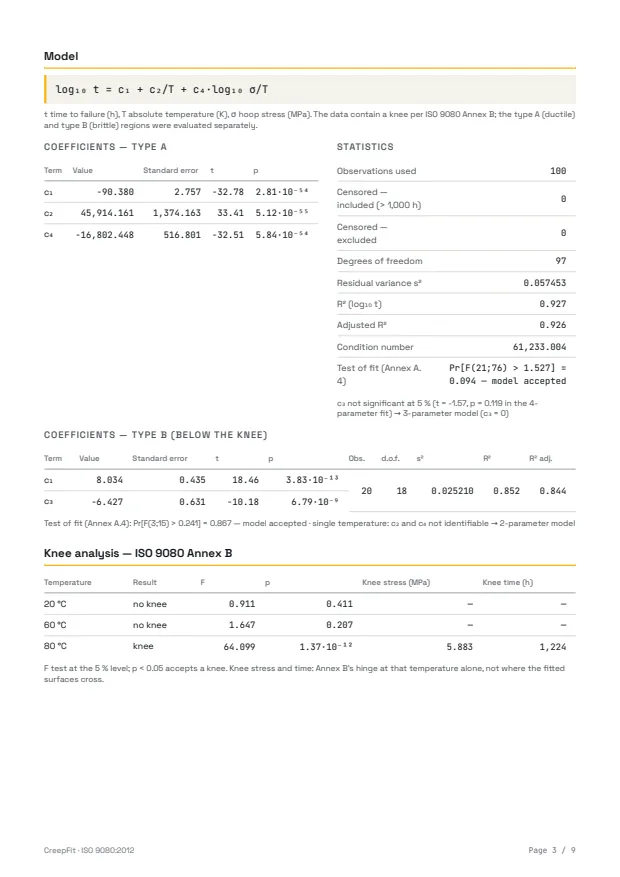
Statistics 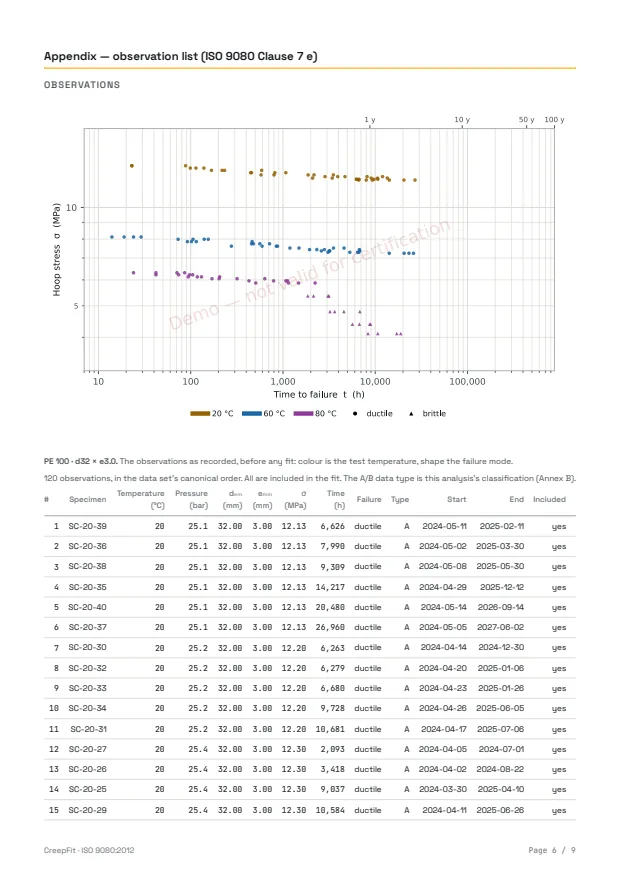
The observation list
CreepFit's calculations conform to ISO 9080.
Where it runs
On premise
CreepFit can be installed on premise, within your own IT infrastructure.
Roles and an audit log
Administrator, analyst and viewer roles; sign-ins, invitations and account changes are written to an audit log.
This is the public demo. Laboratories run CreepFit within their own IT infrastructure.